Debugging, traces & UI mode
Break things, debug them and analyze with the trace viewer.
You recorded your first tests in the previous lesson — but recorded code is rarely the code you ship. Selectors break, pages take a beat to render, the network does something unexpected. Before we write any more tests, let's learn how to figure out why a test failed.
Playwright ships an unusually rich set of debugging tools: UI mode for live development, --debug for terminal step-through, the VS Code extension for breakpoint debugging, and traces (which I like to call "time-travel snapshots") for runs that already happened (CI failures, a co-worker's machine, last night's nightly run).
UI mode — this is the way
For years the community begged for a "watch mode" from the Playwright team. It never came. Instead we got something much better — UI mode.
$ npx playwright test --ui
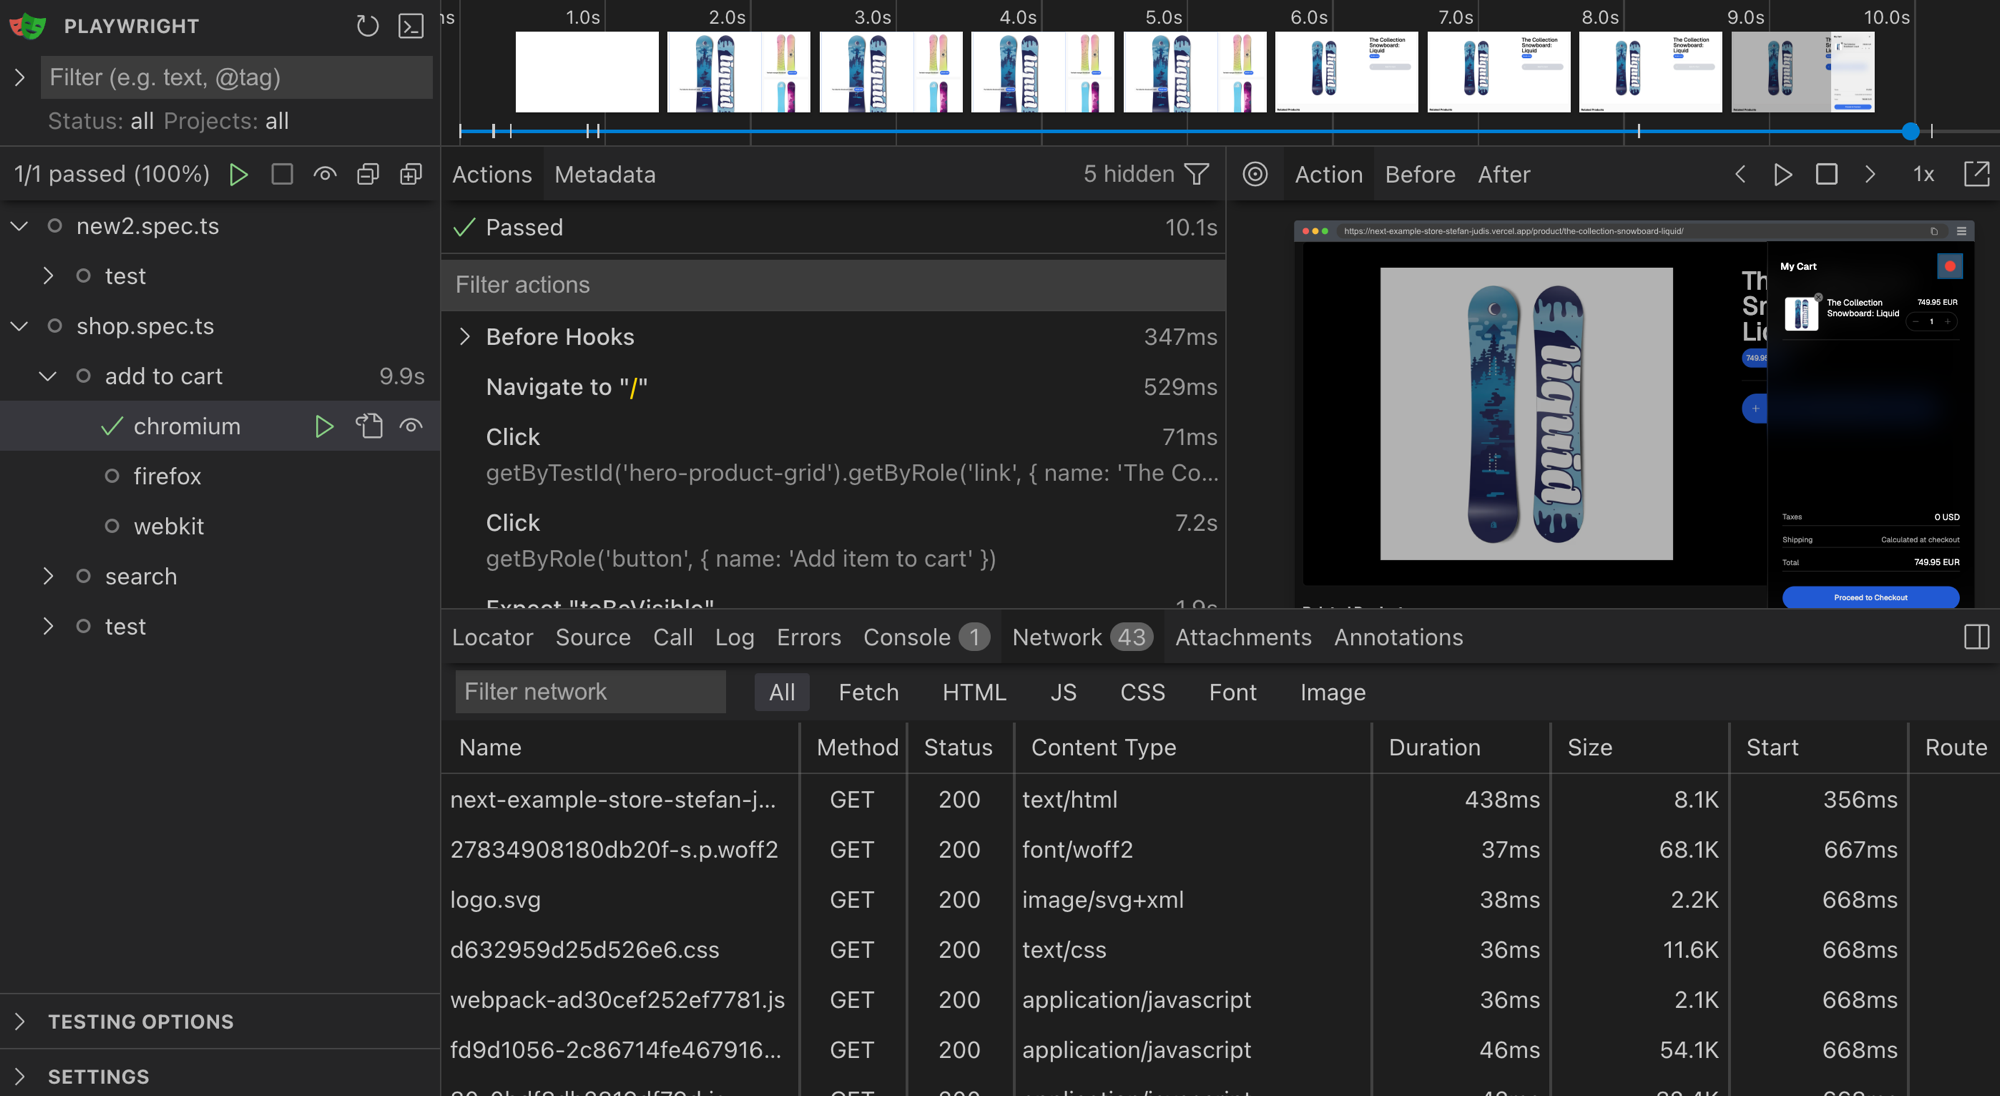
Inside UI mode you get, all in one window:
- Watch mode — tests re-run on every file save
- DOM snapshots — hover over any step to time-travel into the page
- Network waterfall — every request the test made
- Console + errors panel — did the page throw? You'll see it
- Locator picker — point-and-click to generate a robust locator
- Trace Viewer built in — pause on any step and scrub
Open it. Live in it. You'll thank yourself once the tests start failing.
You can also combine --ui with --headed which is my preferred way of using
UI mode.
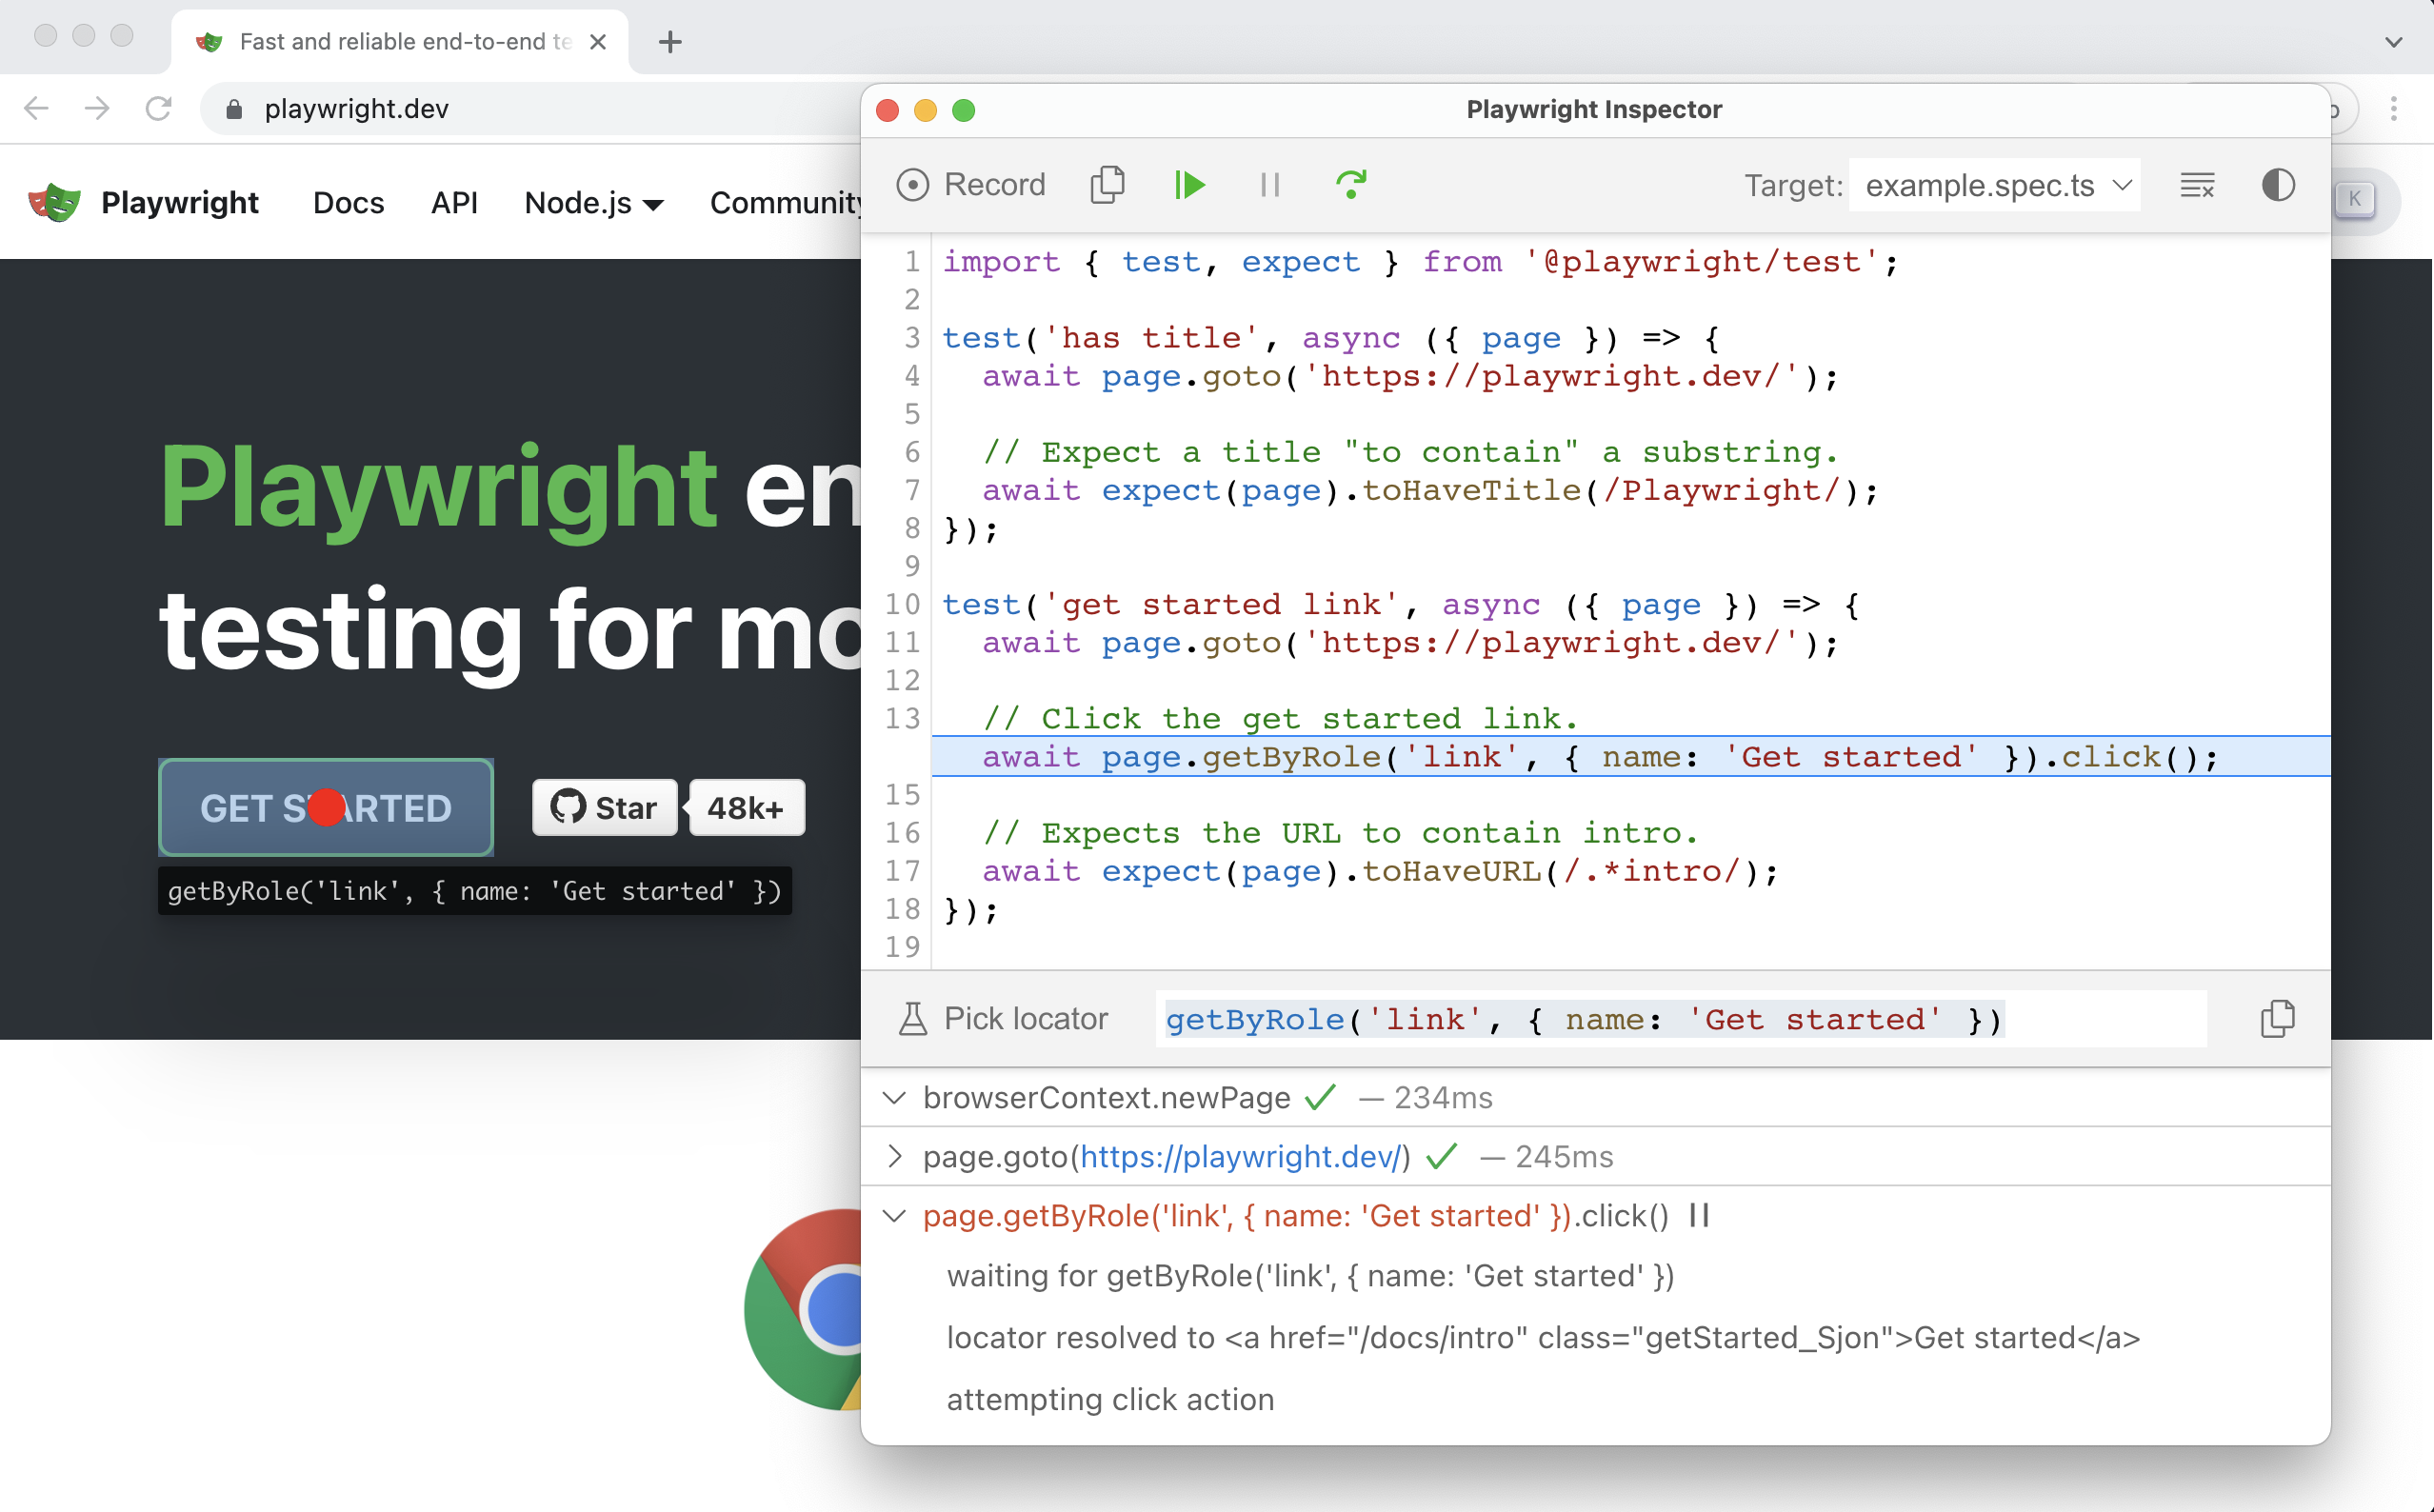
Debugging via the Playwright inspector using --debug
Sometimes you just want to step through a test in the terminal without leaving the keyboard. The --debug flag opens the Playwright Inspector and pauses on every action.
$ npx playwright test --debug
$ npx playwright test tests/shop.spec.ts --debug
Check all available test options via npx playwright test --help.
To only run a single test in one file from the command line, leverage
test.only.
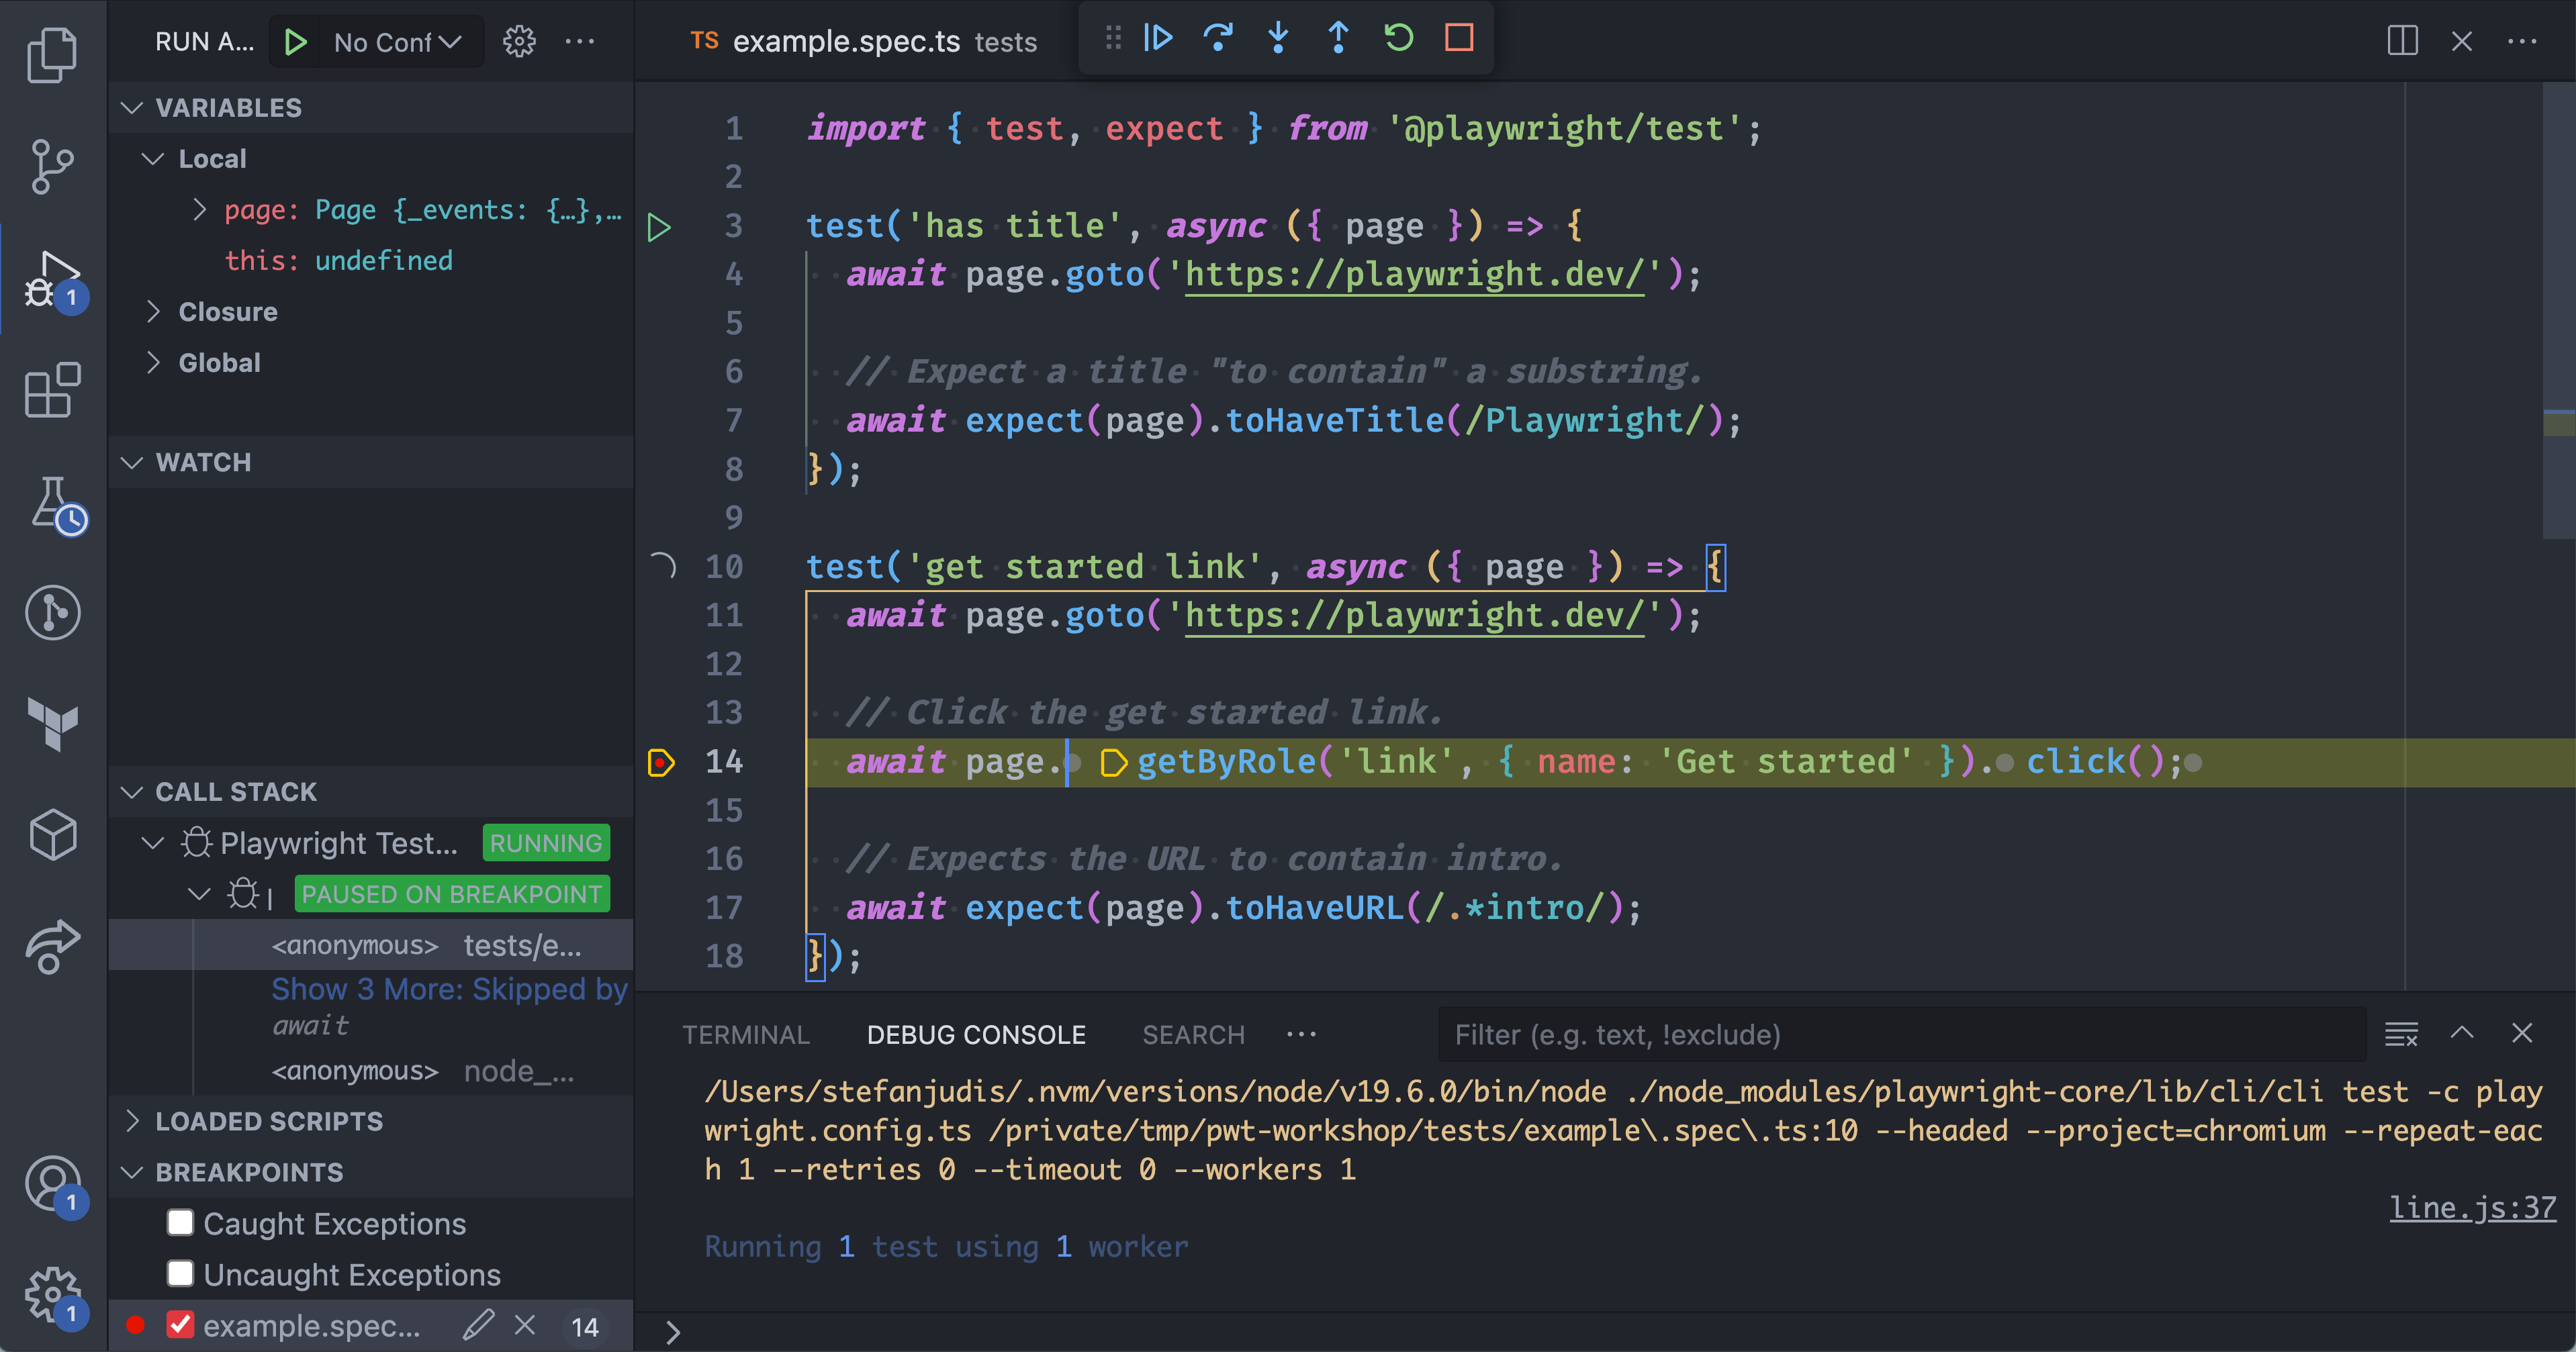
Debugging in VS Code
For gnarly debugging sessions the official VS Code extension is fantastic — it lets you set breakpoints, inspect variables, and step through your test like any other Node script. It's a native debugging experience for your controlled browser session.
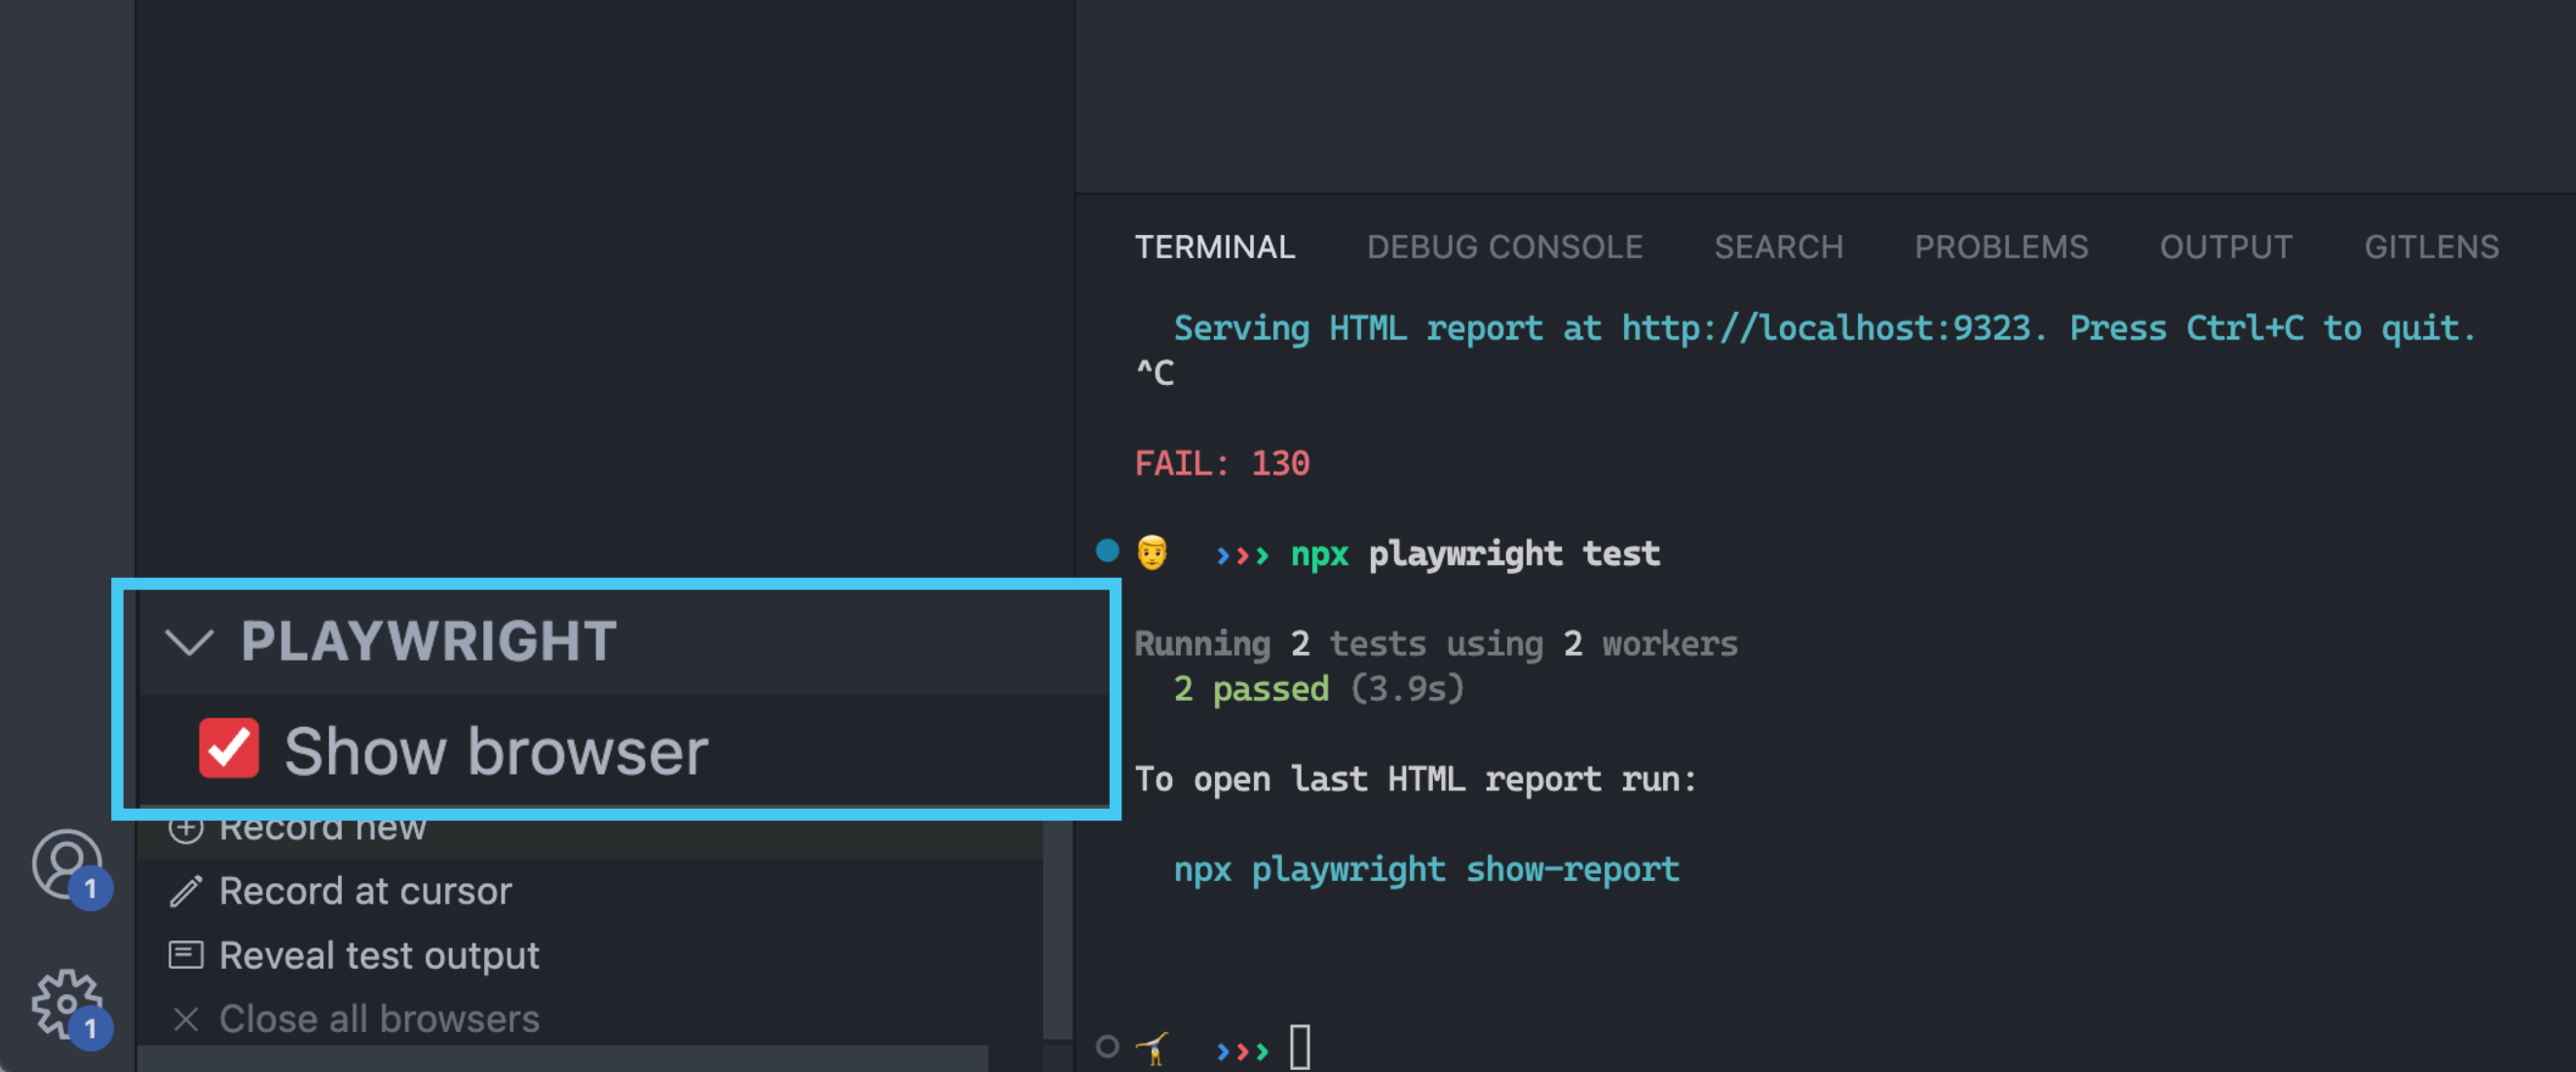
If you're running and debugging tests, ensure that you have ticked Show browser to see what's happening.
Traces — time travel for CI failures
The debugger is great while you're writing tests. But what about a run that failed in CI, on your colleague's machine, or in last night's nightly? You can't attach a debugger after the fact — but you can read a trace.
A trace is a snapshot recording of every action your test performed. It includes console messages, network information, full HTML snapshots of every step, screenshots, and much more.
By default Playwright doesn't collect traces locally (they're heavy). To learn what they're about, flip them on for every run in playwright.config.ts:
export default defineConfig({
  use: {
    trace: "on",
  },
  // ...
});
Now run your tests:
$ npx playwright test
trace: on writes a fresh trace.zip per test under test-results/. There are three good ways to open them.
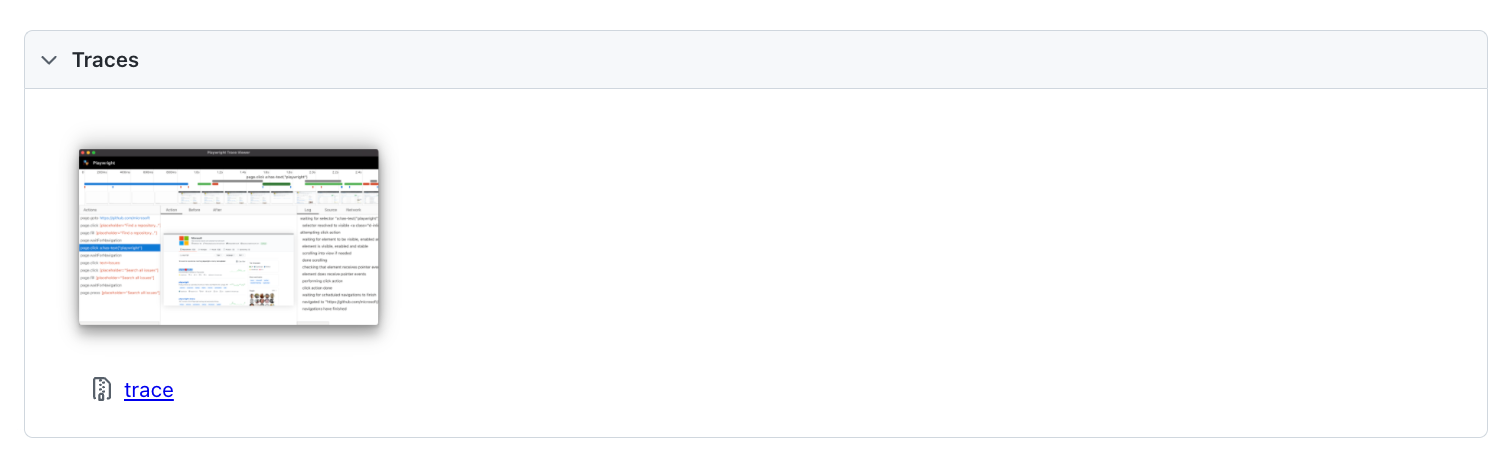
From the HTML report
Whenever a trace was recorded, the generated HTML report links to it.
From the command line
$ npx playwright show-trace test-results/example-has-title-chromium/trace.zip
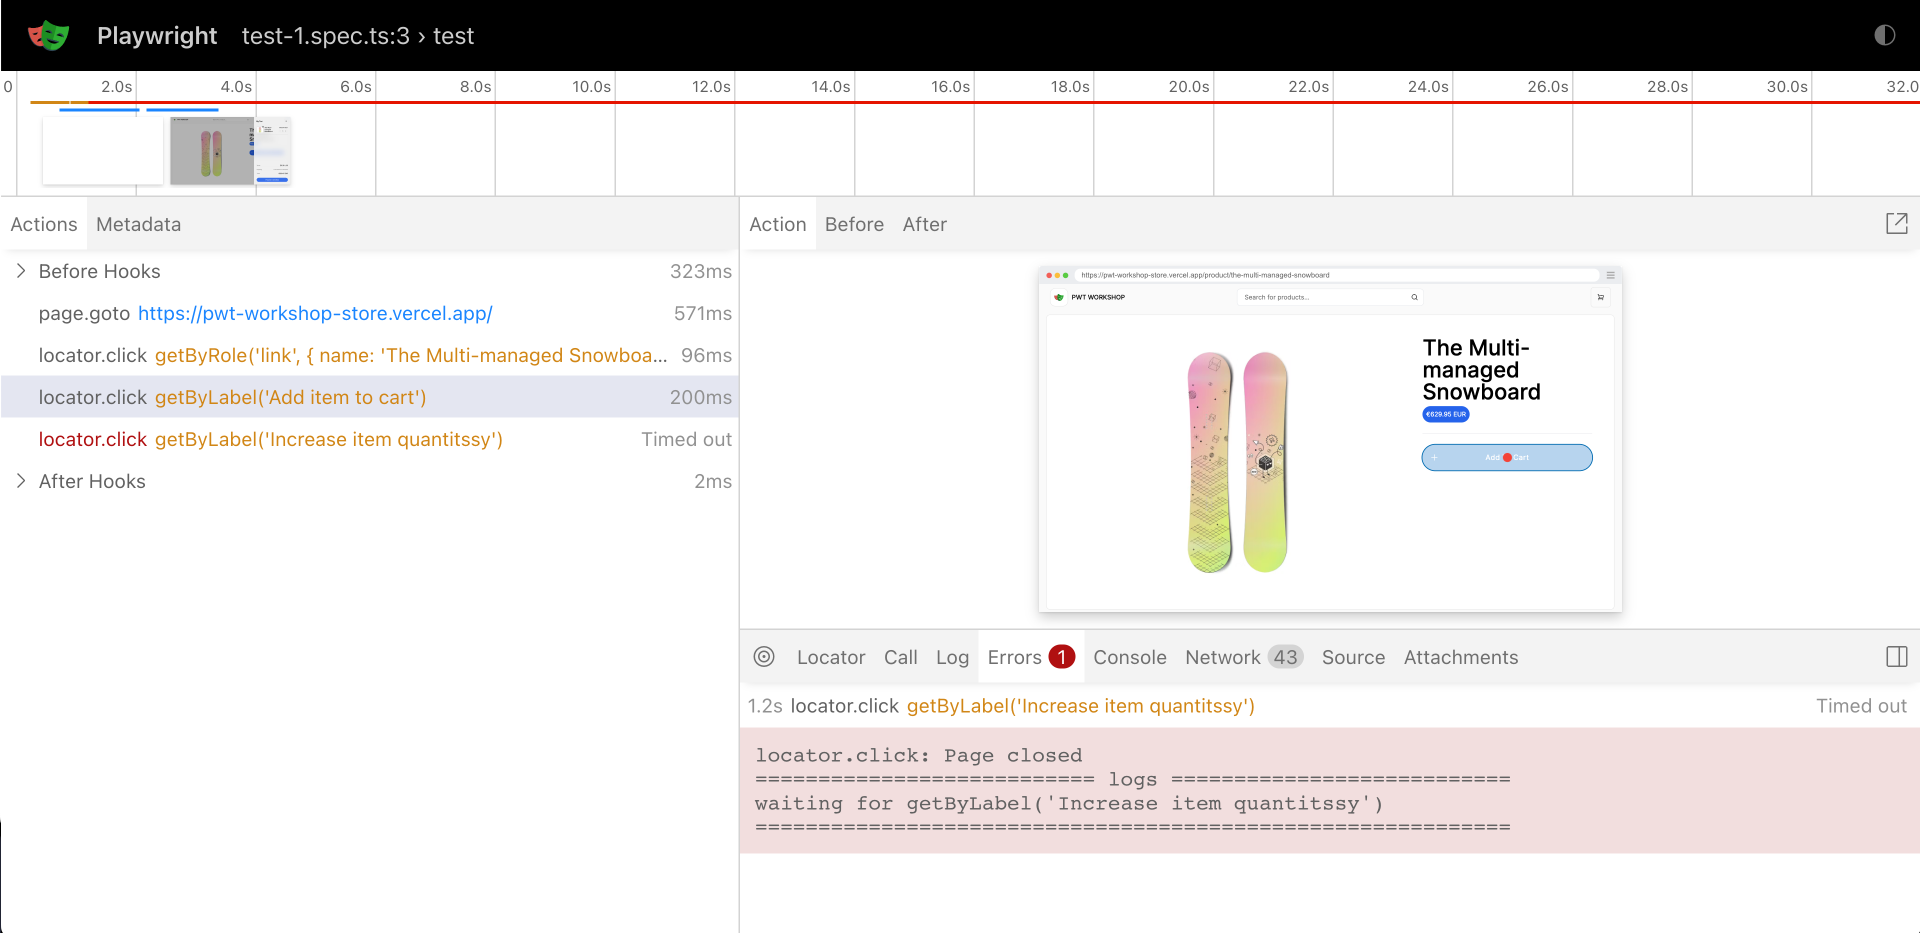
The trace viewer visualizes every test step, a timeline, and a full HTML snapshot of the page at that step. It's time-travel debugging for your end-to-end tests.
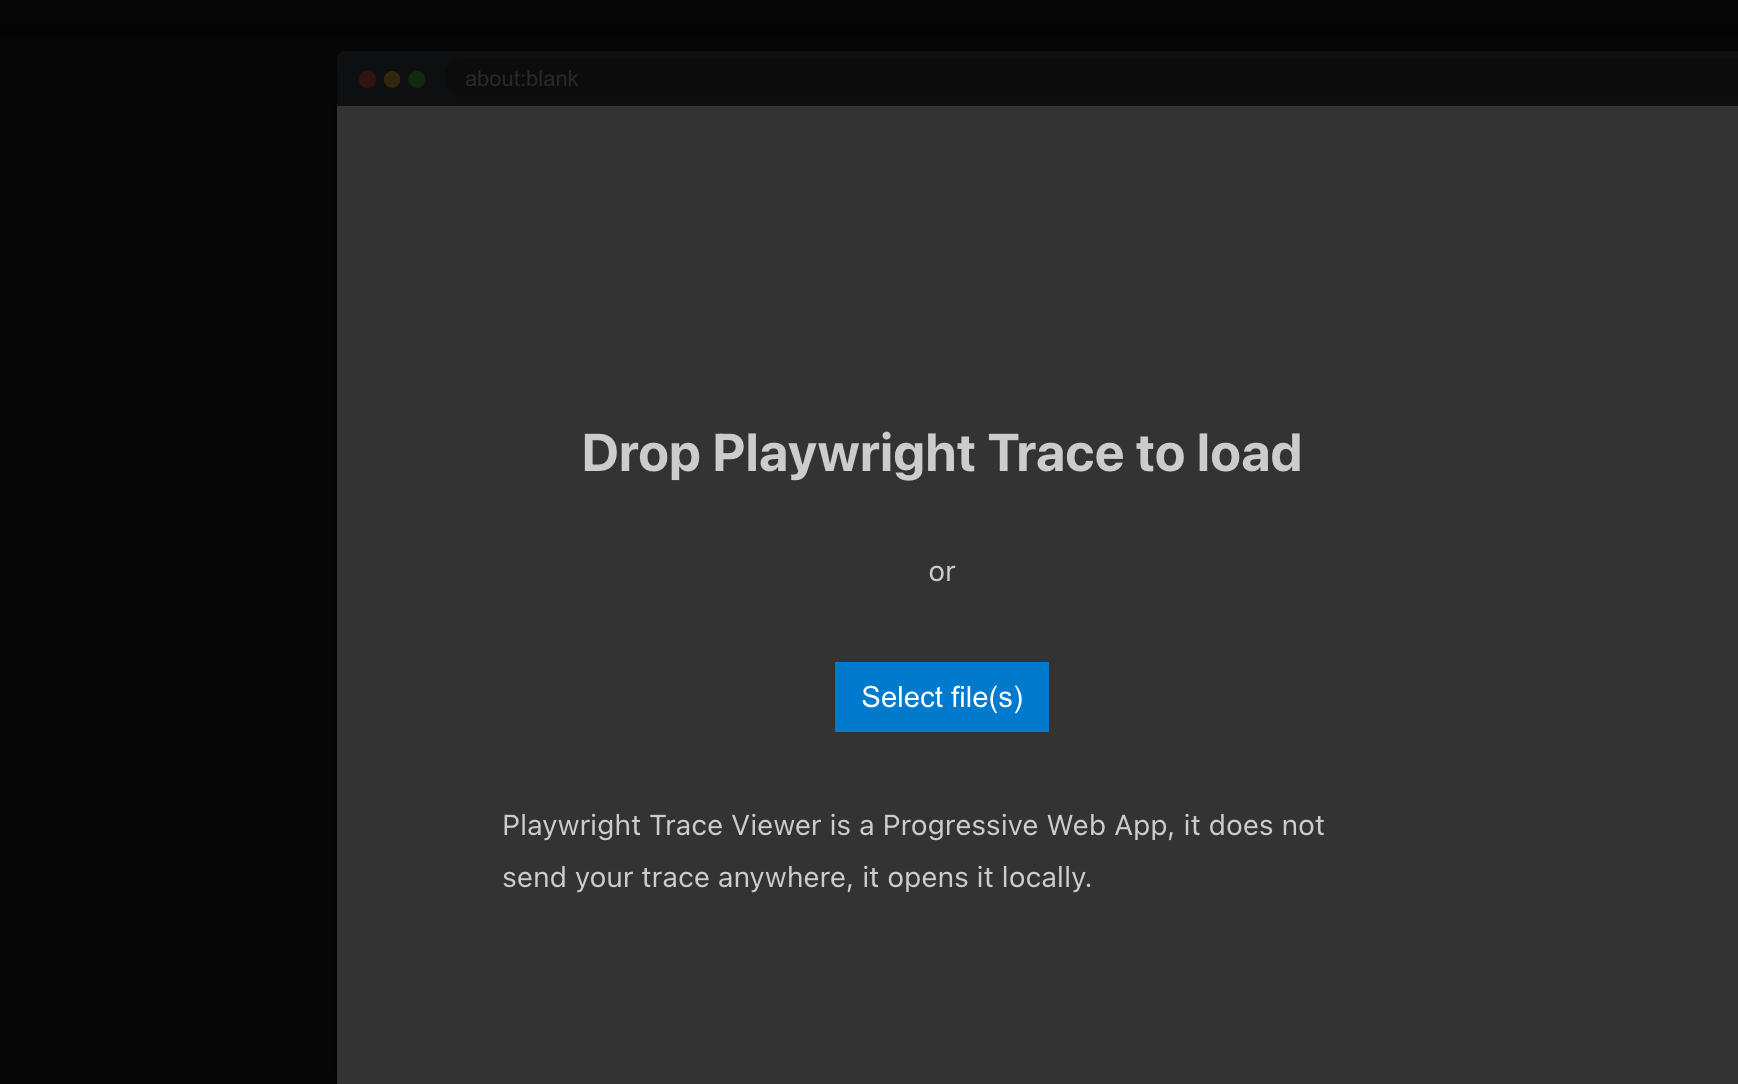
From the online viewer
You don't need Playwright installed at all to read a trace — drag a trace.zip onto trace.playwright.dev and it opens in your browser.
In production you probably don't want trace: "on" (every run, every test
generates a zip). The defaults you'll most often reach for are
"on-first-retry" and "retain-on-failure" — collect traces only when
something actually went wrong.
TODO Speedboard — the timeline view (Playwright 1.58+)
Playwright 1.58 added the Speedboard — a horizontal timeline inside the trace viewer that shows each action with its duration, navigations, and network activity stacked side-by-side. It's the fastest way to spot the part of a test that's slow or stuck.
The Speedboard lives in the trace viewer, both in UI mode and in any show-trace session — no extra config needed. Open a trace and look for the timeline strip above the action list.
It's especially useful when:
- A test is "slow but passes" and you want to know which step ate the budget
- An action waited for the network and you want to see which request
- A flaky test only fails when one specific request is delayed
The Speedboard is part of the trace viewer, so the same trace: "on" /
"on-first-retry" setting controls whether you get one.
Hands-on — break it, then fix it
The fastest way to get fluent with the debugging tools is to break a working test on purpose and recover from it.
TODO provide code snippet with a broken test...
Break a locator
- Open one of the tests you recorded in the previous lesson.
- Pick a
getByRole/getByLabelcall and change its name to something that doesn't exist on the page (e.g."Add to bucket"instead of"Add to cart"). - Run the test — it should fail with a locator timeout.
Find it with UI mode
- Run the failing test in UI mode:
npx playwright test --ui. - Click the failed step in the action list.
- Use the DOM snapshot to inspect what was actually on the page when the locator timed out.
- Open the locator picker and click the real "Add to cart" button — copy the suggested locator.
- Paste it back in, save, and watch UI mode re-run the test green.
Read the trace
- Set
trace: "on"inplaywright.config.ts. - Re-break the locator and run
npx playwright test(no UI mode this time). - Open the HTML report (
npx playwright show-report) and click into the failed test's trace. - Find the failed step in the Speedboard timeline. How long did Playwright wait before giving up?